1. Adsorption on Carbon Nanotubes by GCMC Simulations
The adsorption of water on Single Wall Carbon Nanotubes (SWCNT) is studied by means of Grand Canonical Monte Carlo (GCMC) simulations in MedeA®[1]. Hysteresis during the adsorption/desorption of water on SWCNT(11,0) is observed, in agreement with available experimental data [3].
Keywords: sorption, Grand Canonical Monte Carlo, GCMC, nanotubes, water
1.1. Single Wall Carbon Nanotubes
Carbon nanotubes are cylindrical structures formed by rolling sheets of graphene. Depending on their geometric characteristics they may be either metals or semiconductors. They are characterized by their:
- Length
- Diameter
- Chirality
- Number of nested tubes (Single Wall Carbon Nanotubes / Multi Wall Carbon Nanotubes)
SWCNTs of differing chirality and diameter are shown in Figure 1.1.1. The primitive cells of the structures are depicted in green.
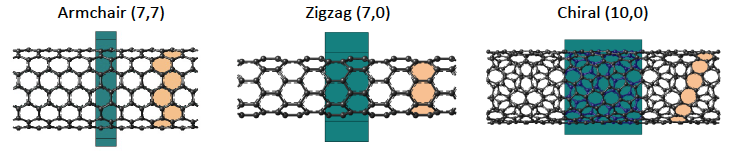
Figure 1.1.1 SWCNTs of different chirality and diameter. The primitive cell of the system is shown in green and the orange shaded rings are a visual aid to show the way the graphene layer has been “folded” for building each nanotube.
1.2. Simulation Details
Water adsorption and desorption on a SWCNT(11,11) is carried out via Monte Carlo (MC) adsorption simulations in the Grand Canonical (GC) ensemble.
In these simulations, the fugacity of water is imposed (simulation input) and the sorbed amount of water is obtained as a simulation result (simulation output).
Considering the solid as rigid, the solid-guest potential energy of interaction is calculated on a finely meshed grid of one unit cell of the solid. Treating the solid as a rigid body implies that all its atoms are at fixed positions and are unable to move. After the calculation of the potential grid, the atoms of the solid will never be considered explicitly again to calculate interactions. The calculation of the interaction grid is done on one unit cell and may be replicated many times in every direction in order to acquire the desired system size. Pre-computing the fluid-solid interaction on a primitive cell allows for a significant speed-up of the simulations.
Adsorption and desorption isotherms are computed in a single simulation job which consists of several GCMC [2] runs running either serially, each starting from the final configuration obtained during the preceding run, or in parallel, each starting from the same initial configuration.
Fluid-solid and fluid-fluid interactions are modeled via Lennard-Jones non-bond interactions using the Lorentz-Berthelot mixing rule. The TIP4P model [4] is used for water and a forcefield for carbon atoms in slit carbon pores [5] is used for the carbon atoms.
1.3. Simulation Results
From the snapshots shown in Figure 1.3.1, we can see that water molecules are occupying the space in the middle of the nanotube. Hydrogen bonds are connecting the water molecules into an elongated cluster in the middle of the pore.
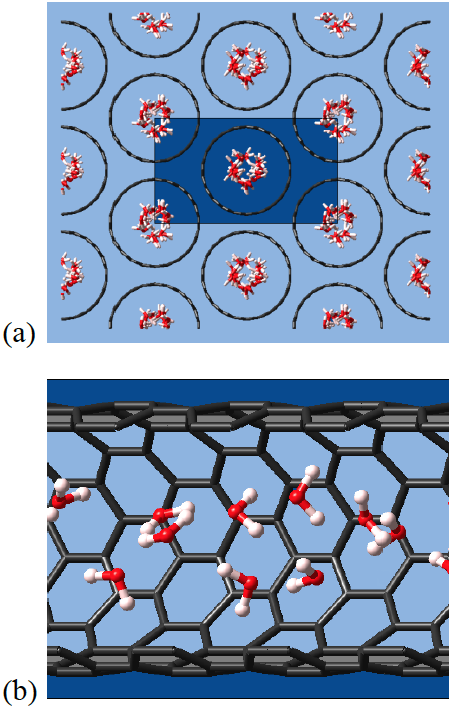
Figure 1.3.1 Snapshots of water in SWCNT(11,11) at T=289K: (a) top and (b) side view.
The adsorption isotherms shown in Figure 1.3.1 are obtained by running GCMC simulations at different imposed fugacities of water. For each isotherm, all simulation runs (one for each different value of the imposed fugacity, yielding to a point in the isotherm) initiate from the same configuration of empty SWCNT(11,0) and run on different processors, in parallel, as different tasks. After all runs are finished, the JobServer gathers all different tasks and their already performed analysis and combines the results, printing out the entire isotherm.
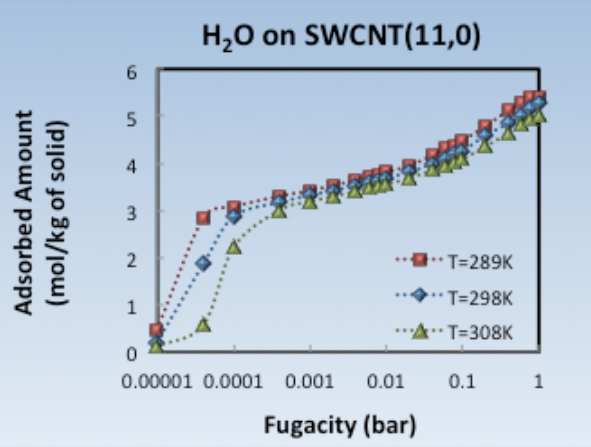
Figure 1.3.2 Adsorption isotherms of H2O on SWCNT(11,0) at T=289K (red squares), T=298K (blue rhombi) and T=308K (green triangles).
The adsorption and desorption isotherm shown in Figure 1.3.3 is obtained by running each simulation run starting from the final configuration of the previous run. This is done for the entire adsorption/desorption cycle. During an adsorption/desorption cycle, we can clearly observe a hysteresis loop (Figure 1.3.3). The existence of such hysteresis loops has also been experimentally observed [3] for bundles of similar sized nanotubes (diameter ~1.4nm). The origin of hysterisis loops may vary, from the presence of metastable states to diffusional limitations, and therefore affects the reproducibility of such effects through MC simulation. Therefore, hysterisis caused by diffusional limitations would be beyond what could be studied with MC.
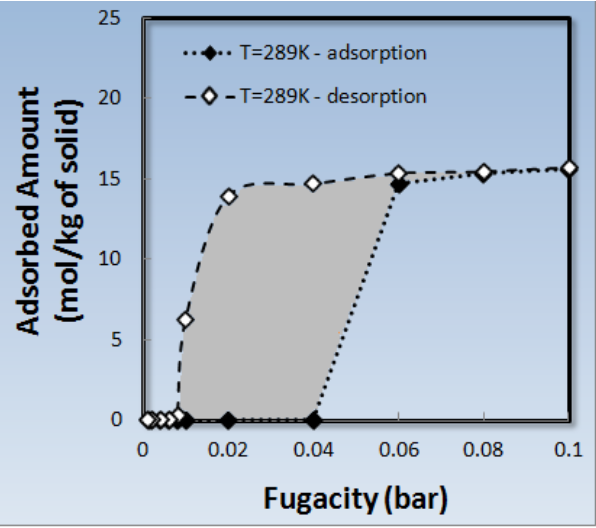
Figure 1.3.3 Sorption isotherms of H2O on SWCNT(11,11) at T=289K. Adsorption path is shown with filled symbols and desorption with empty symbols (the dotted and dashed lines are just a guide to the eye).
1.4. Computational Effort
The adsorption isotherms shown in Figure 1.3.2 are obtained in less than two hours (per isotherm), using 4 CPUs per point. Availability of CPUs can therefore lead to obtaining very rapidly such adsorption isotherms, while only one Flowchart is used and only one Job is submitted. This allows an easy and efficient management of data and the avoidance of multiple simulation run submissions and book-keeping from the user.
The adsorption/desorption cycle shown in Figure 1.3.3 is obtained in two days, using 4 CPUs. The ability to start a simulation from the final configuration of the previous point (in this case) in the isotherm, allows us to observe such phenomena as desorption hysteresis, while maintaining a reasonable simulation time, as equilibration is much easier and faster reached when starting to a near-equilibrium point.
Required Modules
| [1] | MedeA and Materials Design are registered trademarks of Materials Design, Inc. |
| [2] | GCMC stands for Grand Canonical ensemble Monte Carlo. In a Grand Canonical ensemble simulation, the temperature, overal volume and chemical potential(s) are imposed |
| [3] | (1, 2) S. Mao, A.Kleinhammes and Y. Wu, “NMR study of water adsorption in single-walled carbon nanotubes”, Chemical Physics Letters 421, 513-517 (2006) |
| [4] | W. L. Jorgensen, J. Chandrasekhar, J. D. Madura, R. W. Impey and M. L. Klein, “Comparison of simple potential function for simualting liquid water”, J. Chem. Phys. 79, 926-935 (1983) |
| [5] | S. Jakobtorweihen, C. P. Lowe, F. J. Keil and B. Smit, “A novel algorithm to model the influence of host lattice flexibility in molecular dynamics simulations: loading dependence of self-diffusion in carbon nanotubes”, J. Chem. Phys. 124, 154706 (2006) |
| download: | pdf |
|---|